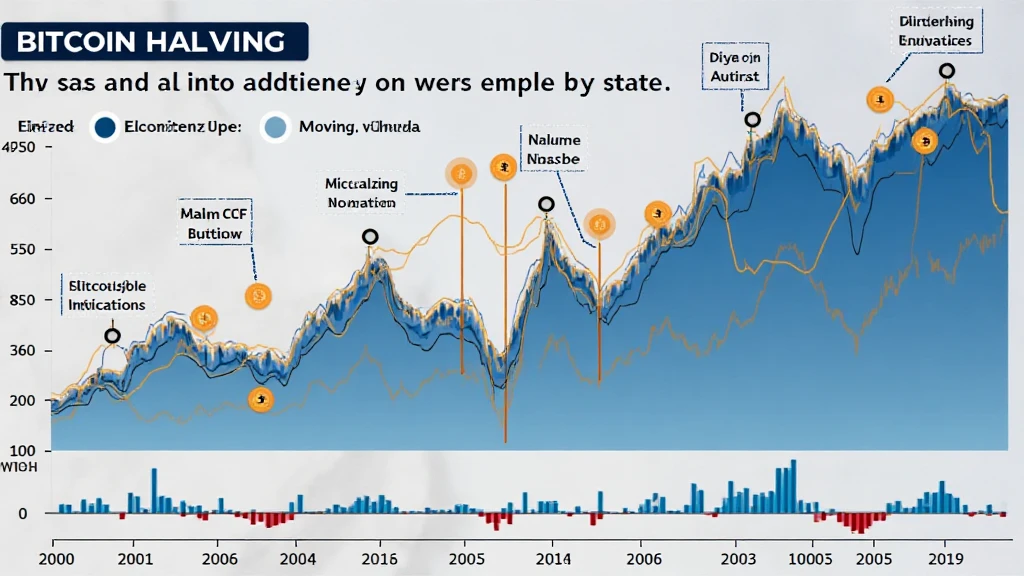
Understanding Bitcoin Halving Technical Indicators
Bitcoin halving, a key event in the cryptocurrency world, occurs approximately every four years and reduces the block reward miners receive by half. This event has significant implications on the supply of Bitcoin, which in turn influences price movements and market sentiment. With over $4 billion lost to DeFi hacks in 2024, understanding Bitcoin’s economic model becomes more crucial than ever. Let’s break it down and see how technical indicators can help us assess the impact of halving on Bitcoin and the broader cryptocurrency market.
What is Bitcoin Halving?
Bitcoin halving is an event that occurs every 210,000 blocks mined, resulting in a 50% reduction in mining rewards. This process is embedded in Bitcoin’s code to ensure a controlled supply, leading to scarcity. The last halving occurred in May 2020, where the block reward dropped from 12.5 BTC to 6.25 BTC. The upcoming halving is anticipated in 2024, which will further reduce the reward to 3.125 BTC.
- 2024 Halving: Expected to double the rarity of Bitcoin.
- Historical Impact: Previous halvings have led to substantial price increases.
- Supply Dynamics: Limitations on the creation of Bitcoin.
Technical Indicators to Watch for Bitcoin Halving
When analyzing the potential implications of Bitcoin halving, several key technical indicators should be monitored. Here’s a detailed overview:

1. Moving Averages
Moving averages are critical for identifying trends. For instance, the 50-day and 200-day moving averages can indicate bullish or bearish trends. A golden cross, where the short-term average crosses above the long-term average, often signifies a bullish market.
2. Relative Strength Index (RSI)
The RSI measures the velocity and magnitude of price movements, helping traders identify overbought or oversold conditions. An overbought RSI (above 70) might suggest a market correction, while an oversold RSI (below 30) could indicate a buying opportunity.
3. MACD (Moving Average Convergence Divergence)
MACD is a trend-following momentum indicator that shows the relationship between two moving averages of a security’s price. Traders often look for signal line crossovers and diverging patterns to assess potential price action.
4. Volume Indicators
Increased trading volume often precedes significant price movements. Indicators like On-Balance Volume (OBV) can help confirm trends by showing buying and selling pressure.
5. Bitcoin Dominance
Bitcoin dominance refers to Bitcoin’s market capitalization relative to the rest of the cryptocurrency market. Higher dominance often points to a bullish sentiment for Bitcoin, especially around halving events.
Vietnam Market Implications
Notably, Vietnam has seen a surge in cryptocurrency adoption, with a user growth rate of over 40% in 2023. This has sparked interest in Bitcoin and its technical indicators, especially leading up to halving events. Local traders should be aware of how global Bitcoin trends impact local market dynamics.
- According to hibt.com, Vietnam’s trade volume has significantly increased during previous halvings.
- Local exchanges are preparing for heightened activity as the next halving approaches.
Real-World Examples of Bitcoin Halving Effects
Examining past events provides insights into future trends. After the 2016 halving, Bitcoin’s price increased from about $450 to nearly $20,000 within the next 18 months. Similarly, post-2020 halving, Bitcoin reached an all-time high of over $60,000, showcasing the impact of supply reduction on price.
| Halving Date | Price Before Halving | Price 12 Months After |
|---|---|---|
| November 2012 | $12 | $1,200 |
| July 2016 | $650 | $2,500 |
| May 2020 | $8,800 | $61,000 |
Preparing for the Next Halving
As the next Bitcoin halving approaches, it’s essential for investors and traders to formulate strategies based on technical indicators and market sentiment. Always consider the following:
- Stay informed on market news from reliable sources like hibt.com.
- Utilize tools such as trading bots for real-time analysis.
- Understand psychological market trends around halving events.
In conclusion, Bitcoin halving is not just a technical event but a significant milestone that influences market dynamics. By comprehensively analyzing technical indicators, traders can position themselves to capitalize on potential opportunities surrounding this event. The intricacies of Bitcoin’s supply economics can lead to substantial price movements, making it indispensable for any investor to stay alert and informed.
Disclaimer: This article is not financial advice. Always consult local regulators and conduct your research before investing.
About the Author
John Doe, a seasoned blockchain analyst with over 10 years of experience, has published more than 20 papers on cryptocurrency markets and has led numerous security audits in the blockchain sector.


