Introduction
Bitcoin halving has long been a focal point for both investors and enthusiasts within the cryptocurrency community. Since its inception in 2009, Bitcoin has undergone significant transformations, with halving events occurring approximately every four years. Each of these events brings with it substantial implications for Bitcoin’s value and market behavior. To put things into perspective, let’s examine the facts: since the first halving in 2012, Bitcoin’s price skyrocketed from around $12 to over $1,000 by the end of that year. Similarly, the third halving in May 2020 marked a watershed moment, with Bitcoin once again approaching its all-time high of approximately $64,000 in April 2021. Understanding the historical trends associated with Bitcoin halving provides valuable insights for potential investors and market participants. This article will delve into past halvings, explore how they affect market trends, and look forward to how they may shape the future of Bitcoin, especially as we approach the next halving projected for 2024.
What Is Bitcoin Halving?
At its core, Bitcoin halving is an event that occurs approximately every four years or every 210,000 blocks mined. During this event, the reward that miners receive for validating transactions on the network is halved. Initially set at 50 BTC per block, the reward has decreased to 6.25 BTC following the third halving. The mechanism was integrated by the Bitcoin creator, Satoshi Nakamoto, as a method to control inflation and gradually reduce the supply of Bitcoin over time, mirroring the scarcity of precious metals like gold.
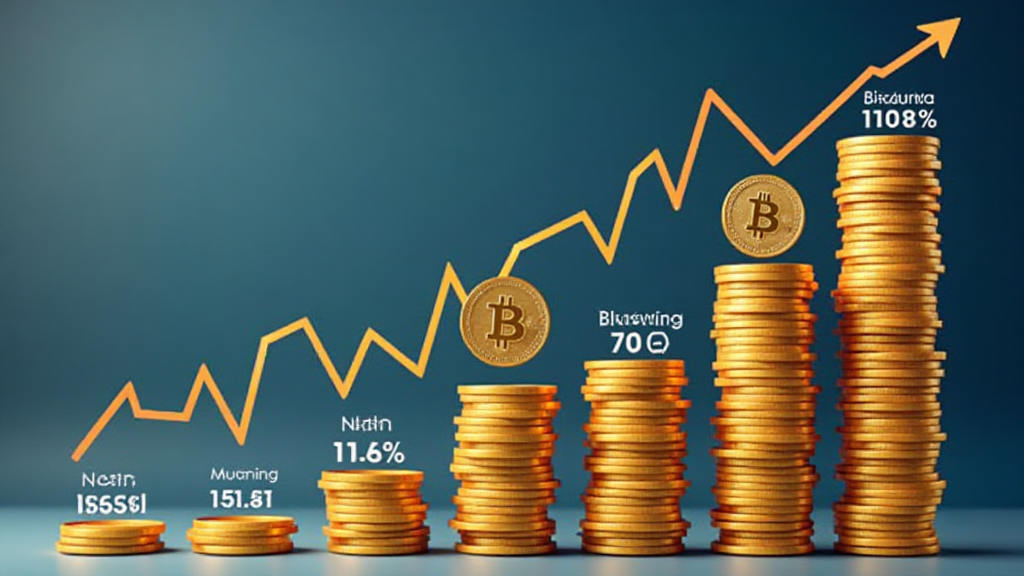
Bitcoin halving events are pivotal because they create a systematic decrease in the issuance of new bitcoins. Here’s a breakdown of the historical halvings:

- First Halving (2012): Reward reduced from 50 BTC to 25 BTC
- Second Halving (2016): Reward reduced from 25 BTC to 12.5 BTC
- Third Halving (2020): Reward reduced from 12.5 BTC to 6.25 BTC
Historical Price Trends Following Halvings
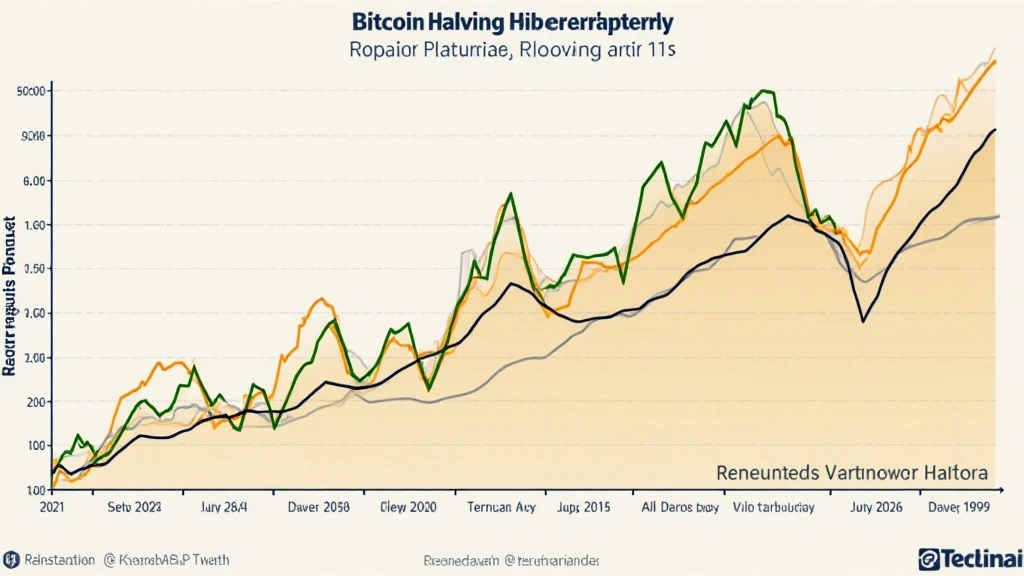
As mentioned earlier, Bitcoin’s price tends to follow a specific pattern after each halving event. The price often experiences an upward trend in the months and years following the halving. However, it’s important to note that this is not a guaranteed outcome. Here’s a closer look at the price movements following each halving:
- After the 2012 halving: The price surged to over $1,000 by late 2013.
- After the 2016 halving: Bitcoin reached nearly $20,000 by December 2017.
- After the 2020 halving: Bitcoin approached $64,000, retrieving its attention globally.
This historical performance suggests a strong correlation between Bitcoin halvings and subsequent price appreciation. However, it’s essential to understand that external factors, including market sentiment, regulatory changes, and global economic conditions, play significant roles in these price movements.
Market Reaction and Sentiment Analysis
Market sentiment can shift dramatically in response to halving events. The anticipation before a halving often generates a sense of excitement and speculation among investors. This sentiment can sometimes lead to price increases as investors position themselves in advance of the supply shock. For example, leading up to the last halving in 2020, Bitcoin’s price saw an increase from around $8,000 to nearly $10,000 in the months leading up to the event.
However, this excitement can also lead to volatility. There’s often a “buy the rumor, sell the news” phenomenon, where investors rush to sell after a halving occurs, expecting that the initial surge in price may not last. Understanding these trends is crucial. Here are some critical indicators to monitor:
- Investor demand leading up to the halving.
- Mining activity and network health.
- Media coverage and public interest on social platforms.
Technical Analysis Post-Halving
Analyzing Bitcoin’s technical charts also provides insight into potential future price movements following a halving. Many traders use Fibonacci retracement levels and moving averages to identify support and resistance zones. Post-halving, Bitcoin has often maintained a bullish trend, supported by increased trading volumes and market activity. This can be attributed to heightened investor interest and confidence in the scarcity of Bitcoin resulting from the halving.
The Future of Bitcoin and Upcoming Halving Events
As we look towards the upcoming halving event projected for 2024, there’s much speculation surrounding its impact on Bitcoin’s price and the overall market. With the existing market conditions and the macroeconomic environment evolving, experts are divided in their predictions. Some argue that the historical trends will repeat, suggesting that Bitcoin could see significant price increases post-halving. Others caution that market dynamics have changed, with institutional adoption and regulatory developments potentially influencing outcomes in unprecedented ways.
Regardless of the outcome, it’s crucial for investors to stay informed and utilize various analytical tools to make educated decisions. Keeping an eye on historical price data, including how Bitcoin reacted post-2012, 2016, and 2020 halvings, can aid in forecasting market behavior.
Conclusion
In summary, understanding Bitcoin halving historical trends is imperative for anyone looking to invest or participate in the cryptocurrency market. While past performance does not guarantee future results, the trends observed over the previous halvings provide valuable insights into potential future price movements. As we approach the next halving, investors should consider not only historical data but also current market conditions, investor sentiment, and regulatory factors that may influence Bitcoin’s trajectory. Many in the community view Bitcoin less as a currency and more as digital gold, especially as supply continues to dwindle. So, stay vigilant, keep learning, and prepare for the next chapter in Bitcoin’s evolving story.
For ongoing insights and updates on cryptocurrency, visit cryptocoinnewstoday.


