Bitcoin Price Chart Patterns Analysis: Understanding Market Trends
With over $4.1 billion lost to DeFi hacks in 2024 alone, understanding bitcoin price chart patterns analysis has never been more critical. As the cryptocurrency market evolves, it brings both opportunities and pitfalls. Recognizing patterns in bitcoin price charts can help investors and traders make informed decisions. This comprehensive guide explores various chart patterns, their implications, and how to utilize this analysis for better trading outcomes.
Why Bitcoin Price Chart Patterns Matter
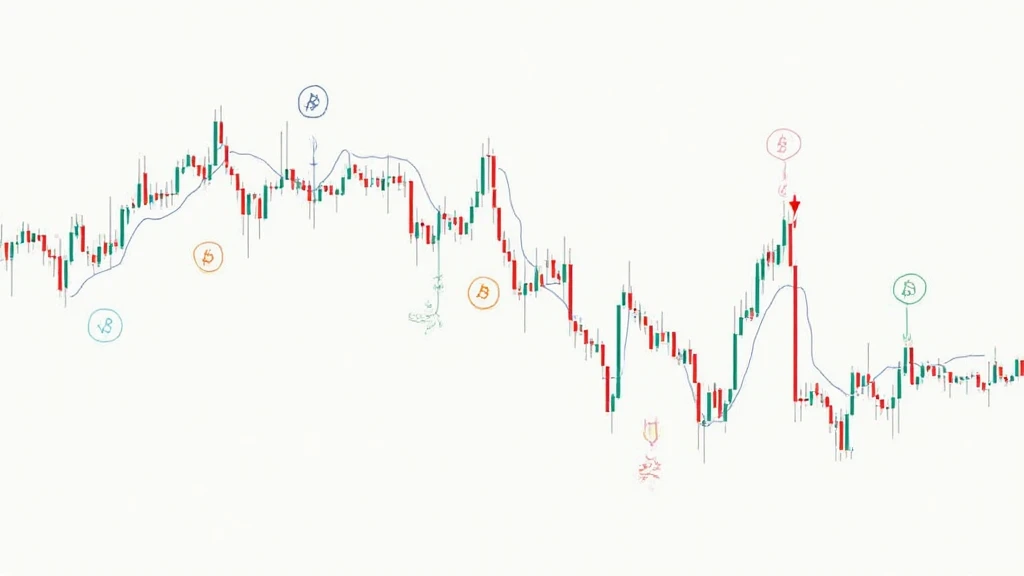
Chart patterns are crucial for interpreting market behaviors. They provide insights into potential future price movements based on historical trends. This pattern analysis mimics traditional technical analysis used in stock trading but is uniquely suited to the cryptocurrency market’s volatility.
Understanding Market Sentiment
- Charts reflect market psychology—bullish trends often indicate buyer confidence, whereas bearish patterns signal fear or uncertainty.
- Recognizing these sentiments can arm traders against sudden market shifts.
Market sentiment can be thought of like a live scoreboard that changes as new information is introduced—profitability and panic are always in flux amongst traders.

Common Bitcoin Price Chart Patterns
There are several prevalent chart patterns seen within the Bitcoin market. Each carries its own implications:
1. Head and Shoulders
This pattern signifies a potential reversal in the price direction. The formation consists of three peaks: a higher peak (head) between two lower peaks (shoulders). It generally indicates a bullish trend followed by a bearish reversal.
2. Double Top and Bottom
- Double Top: This pattern appears after a bullish trend, indicating an impending bearish reversal.
- Double Bottom: Conversely, this pattern occurs at the end of a bearish trend, forecasting a bullish reversal.
3. Flags and Pennants
These are continuation patterns typically forming after a sharp price movement. Flags are rectangular-shaped pullbacks, while pennants resemble small triangles. Both indicate that the prior trend is likely to continue.
Analyzing Bitcoin Price Movements in Vietnam
In Vietnam, the adoption of Bitcoin and other cryptocurrencies continues to grow rapidly. Reports indicate that the number of cryptocurrency users grew by over 50% in 2023. With rising interest in crypto investments, it becomes vital to adopt effective analysis strategies.
- The average Vietnamese investor often looks for reliable tools for price chart analysis.
- Local exchanges are also seeing increased trading volumes, which helps in identifying patterns.
Vietnamese traders must embrace these patterns to navigate the intricacies of the market successfully. For example, recognizing a tiêu chuẩn an ninh blockchain in their trading strategies could bolster their investment confidence.
Tools for Bitcoin Price Chart Analysis
To perform effective chart analysis, several tools and methods can be employed:
- Charting software (e.g., TradingView) offers comprehensive tools for visualizing data.
- Indicator tools (like RSI and MACD) assist in understanding price momentum.
- Backtesting tools allow traders to apply historical data to test strategies.
Investors often choose a combination of these tools to refine their analyses and boost performance metrics.
Strategies for Leveraging Chart Patterns
To maximize profits and minimize risks, it’s essential to follow these strategies:
- Identify and confirm patterns before acting—always wait for a breakout confirmation.
- Set stop-loss orders to manage risks effectively.
- Utilize a risk-to-reward ratio to assess potential profit against risk, aiming for a minimum of 2:1.
Here’s the catch: Just as in traditional stock trading, if it feels too good to be true with high reward potential, it’s advisable to proceed cautiously.
Conclusion: Mastering Bitcoin Price Chart Patterns for Success
For both new and experienced traders, understanding bitcoin price chart patterns analysis is essential for navigating the volatile world of cryptocurrencies. With the right knowledge and tools, traders can decipher market trends and make informed decisions. Localized growth, such as in Vietnam’s vibrant crypto space, presents unique opportunities for smart investing. Always ensure to do proper research, utilize proven tools, and, importantly, consult with financial advisors to navigate this rapidly changing environment.
Stay updated with the latest news and insights at cryptocoinnewstoday.
Written by Dr. Alex Tran, a blockchain finance expert with over twenty published papers and led security audits for renowned projects.


