
Mastering Technical Analysis: Your Ultimate Crypto Guide
As the cryptocurrency market continues to evolve, navigating this digital landscape becomes increasingly challenging. With approximately
Understanding Technical Analysis
Technical analysis involves evaluating financial markets by analyzing historical price data and trading volume, primarily through the use of charts and various indicators. Unlike fundamental analysis, which looks into the overall value of an asset, technical analysis focuses on price movements and market trends.
To get the most out of technical analysis, you must grasp its foundational concepts:
- Price action: This refers to the movement of a cryptocurrency’s price over time.
- Trends: Identifying upward, downward, or sideways market trends is vital.
- Support and Resistance levels: These are key price points where trends may reverse or continue.
- Indicators: Tools like moving averages, RSI, and MACD help pinpoint market conditions.
Just as a skilled chef relies on a well-sharpened knife, traders must wield their technical analysis tools with precision to perform effectively in the cryptocurrency arena.
Essential Tools for Technical Analysis
To achieve success through technical analysis, utilizing the right tools is imperative. Below are some of the key resources you should consider:
For beginners, it is advisable to start with simpler tools and progressively integrate more advanced technologies as your skills develop.
Analyzing Market Trends
Understanding market trends is a fundamental aspect of technical analysis. Here are three major types of trends:
Identifying these trends helps traders align their strategies accordingly. For instance, in an uptrend, one might consider purchasing assets, while in a downtrend, short-selling may be more appropriate.
Support and Resistance Levels
Support and resistance levels play a crucial role in technical analysis. Support is a price level where buying interest is strong enough to prevent the price from declining further. Conversely, resistance is a level where selling interest can stop prices from rising. Understanding these levels can significantly enhance your trading success.
Consider this analogy: Think of support as the floor of a building and resistance as the ceiling. Prices tend to bounce off these more predictable levels, making them essential guideposts for traders by helping to set effective entry and exit points.
Utilizing Indicators and Chart Patterns
With an overwhelming number of technical indicators available, traders must focus on a few key indicators that align with their trading strategy. Some widely used indicators include:
In addition to indicators, familiarizing oneself with common chart patterns, such as head and shoulders, triangles, and flags, can significantly improve trading strategies.
Real-World Applications of Technical Analysis
Unlike theoretical approaches, technical analysis has real-world applications that can guide active traders. By consistently monitoring price changes, translating trends into actionable insights, and back-testing strategies, traders can enhance their decision-making process.
For instance, traders often employ stop-loss orders to mitigate risks effectively. These orders enable automatic selling when the asset’s price falls below a pre-determined level, thus limiting losses.
Leveraging News and Market Sentiment
Another important aspect of the market is sentiment analysis. While technical analysis focuses mainly on price movement, understanding market sentiment can provide valuable context. Many traders keep an eye on social media trends or news articles to gauge the mood of the market.
To illustrate, Bitcoin may experience a price surge following a major announcement by a regulatory body. Being aware of these events can help traders make timely decisions and adapt their strategies accordingly, enhancing their analysis and forecasting success.
Case Study: Successful Trade Using Technical Analysis
To understand better how technical analysis can be applied, let’s analyze a hypothetical trade:
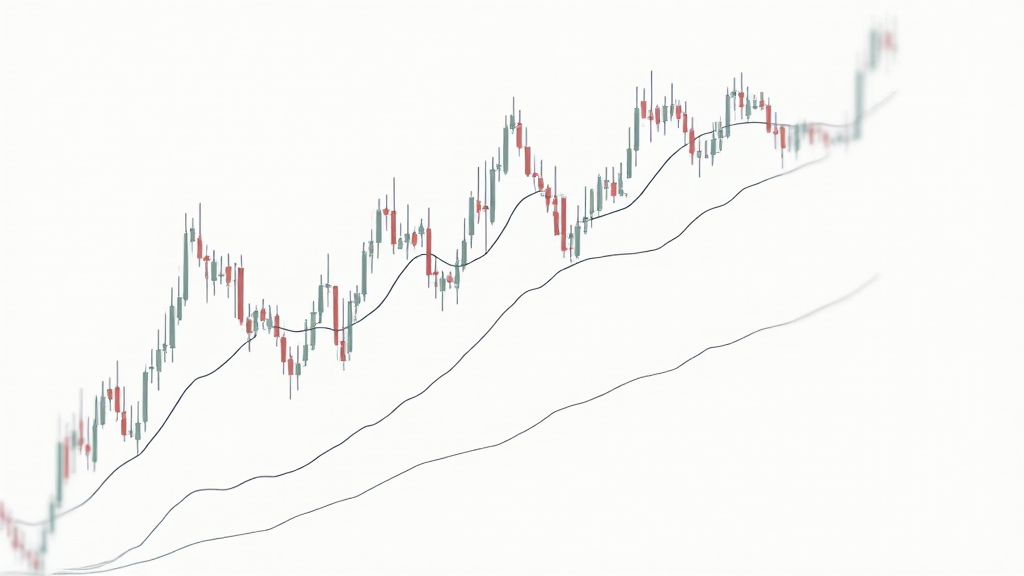
In this scenario, a trader could monitor three moving averages and enter a buy position when the short-term average crosses above the long-term average, indicating a shift from bearish to bullish conditions.
By doing so, with proper risk management established through stop-loss orders, the trader can capitalize on price surges while protecting themselves from unexpected downturns.
The Future of Crypto Trading
The crypto market is highly volatile and continues to change daily. Staying informed with reliable sources and honing your technical analysis skills will position you favorably in this dynamic environment. With increasing adoption rates, particularly in regions like Vietnam, where the user growth rate has skyrocketed, there is immense potential for savvy traders to seize opportunities.
Keep in mind that maintaining the security of your investments is essential. The use of cold wallets (such as Ledger Nano X) has been shown to reduce hacks by over 70%, and securing your assets should always be a priority.
As you embark on or progress in your trading journey, remember that this guide can serve as a solid foundation for mastering technical analysis. Don‘t hesitate to utilize the outlined tools and strategies to enhance your trading experience.
In conclusion, understanding technical analysis is paramount for navigating the unpredictable crypto landscape. By integrating the concepts, tools, and methodologies discussed throughout this guide, you can elevate your trading performance and seize lucrative opportunities.
For further information, check out our article on hibt.com for additional insights and resources. Also, read our Vietnam crypto tax guide to stay updated in the ever-changing regulatory landscape.
Written by Dr. Alice Wong, a noted blockchain expert with over 15 published papers in the field and leading auditor for prominent projects in the crypto space.