
Introduction
With the crypto market undergoing massive fluctuations, understanding candlestick charts has never been more crucial. In 2024 alone, approximately $4.1 billion was lost to various DeFi hacks, emphasizing the importance of making informed trading decisions. Whether you’re a novice trader or someone looking to sharpen your skills, this tutorial will provide you with step-by-step guidelines on how to read crypto candlestick charts effectively.
What are Candlestick Charts?
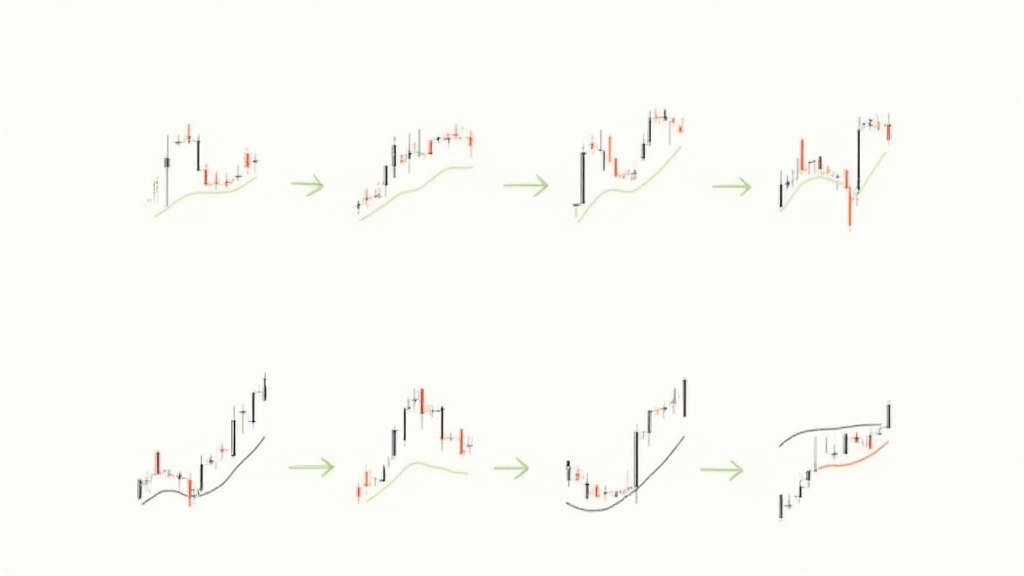
Before diving into the intricacies of reading candlestick charts, let’s clarify what they are. Candlestick charts are a type of financial chart that represent price movements of an asset over time. Each candle provides information about an asset’s open, high, low, and close prices within a specific time frame.
- Open Price: The price at which a cryptocurrency starts trading during the time frame.
- Close Price: The price at which the cryptocurrency ends trading for that time frame.
- High Price: The highest price reached during the time frame.
- Low Price: The lowest price hit during that time frame.
The Anatomy of a Candlestick
Each candlestick comprises two main parts: the body and the wicks (or shadows). The body represents the price range between the open and close, while the wicks indicate the high and low prices during that time period.
Why Are Candlestick Charts Important?
In the volatile world of cryptocurrencies, candlestick patterns can be used to predict future price movements. Recognizing these patterns not only helps in making trades but also allows for better risk management strategies.
Popular Candlestick Patterns
- Doji: Indicates market indecision; the open and close prices are nearly identical.
- Hammer: Suggests a bullish reversal; occurs after a downtrend.
- Engulfing Patterns: Indicate potential reversals; a smaller candle followed by a larger candle engulfing it.
- Morning Star: A bullish reversal pattern, comprising three candles.
How to Read a Candlestick Chart?
Now, let’s break down the process of reading these charts for better understanding:
- Step 1: Identify the Time Frame – Determine what time frame you’ll be trading (e.g., 1 minute, 5 minutes, 1 hour, daily).
- Step 2: Observe the Trend – Is the market in a bullish or bearish trend? Look at the sequence of candles to gauge market sentiment.
- Step 3: Analyze Individual Candles – Check the body and wicks for interpreting the behavior of traders and market momentum.
- Step 4: Look for Patterns – Identify any prevailing candlestick patterns that may indicate a potential price movement.
Using Tools to Enhance Your Candlestick Analysis
Tools like Moving Averages or RSI (Relative Strength Index) can be useful adjuncts to your candlestick analysis. They can help confirm signals given by the candlestick patterns. For instance, if you observe a bullish engulfing pattern along with an oversold RSI, it could signify a strong buying opportunity.
Real-World Application: Case Study
Let’s examine a case study of a cryptocurrency that exhibited strong candlestick patterns. By following the price movements of Bitcoin during a recent bullish surge, we can illustrate how patterns helped traders make informed decisions:
Date       Price
01/01/2024  $40,000
01/02/2024  $42,000
01/03/2024  $41,500
01/04/2024  $43,500
01/05/2024  $45,000
As you can see, several bullish engulfing patterns emerged during this period, providing traders with signals to buy.
Key Takeaways
Understanding crypto candlestick charts is essential for anyone involved in trading. Here’s a quick summary of what we’ve covered:
- Each candlestick provides crucial information about price movements.
- Patterns can indicate future market behaviour.
- Combine candlestick analysis with other tools for better insights.
Conclusion
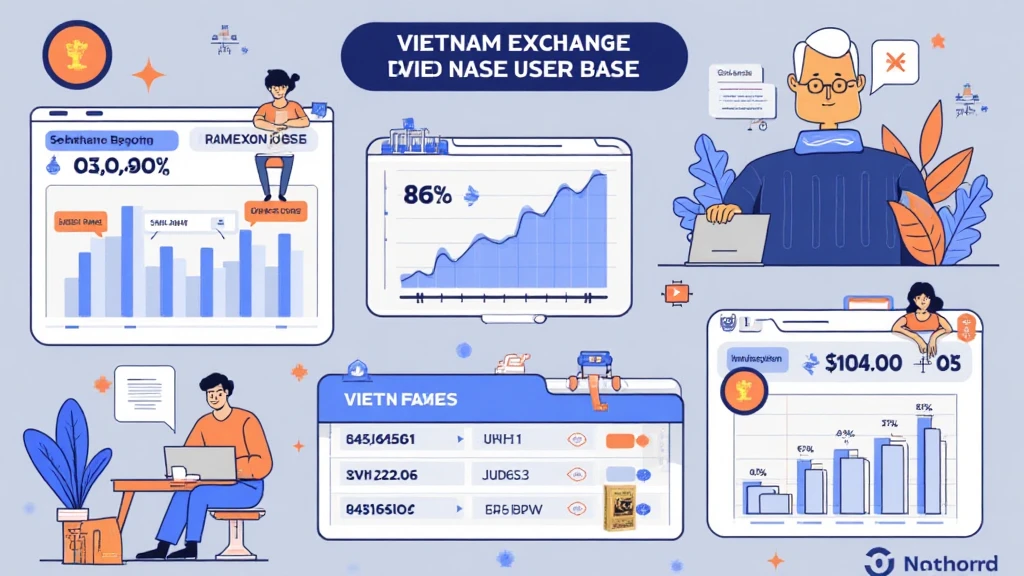
To wrap things up, reading crypto candlestick charts is not only an art but a science requiring practice and careful observation. As the crypto scene evolves, local markets like Vietnam are witnessing user growth rates of over 40% year-on-year, further underlining the importance of mastering these skills. For those looking to navigate this exciting landscape, understanding how to read these charts can significantly enhance trading outcomes.
If you’d like to dive deeper into the world of cryptocurrencies, visit cryptocoinnewstoday for more insights.
About the Author
Dr. Jane Smith is a renowned blockchain consultant who has published over 15 papers in the field and has been instrumental in auditing various high-profile projects. Her expertise offers unique insights into the complexities of the cryptocurrency markets.