Mastering Bitcoin Technical Analysis: Insights and Strategies
With over $2.5 trillion in market capitalization for cryptocurrencies in 2023, Bitcoin continues to be the dominant force, representing a significant portion of this total. However, as the crypto landscape evolves, understanding its price movements and trends becomes crucial for both new and seasoned investors.
In this article, we will delve into Bitcoin’s technical analysis, breaking down components such as price charts, indicators, and market psychology to enhance your investment strategy. By the end, you’ll have a clearer picture of how to navigate the complexities of the Bitcoin market effectively.
Understanding Bitcoin Price Movement
To grasp Bitcoin technical analysis, it’s essential first to understand the driving forces behind Bitcoin price movements. Generally, these can be categorized into fundamental and technical factors. While fundamental analysis involves examining the underlying factors affecting supply and demand, technical analysis focuses on price data and market trends.

As Bitcoin’s popularity grows among retail and institutional investors, many are turning to technical analysis as a reliable way to predict future price movements.
The Importance of Price Charts
Price charts are crucial tools in the Bitcoin trader’s arsenal. They visualize past price movements and help predict future trends. Different types of charts serve various purposes:
- Line Charts: Simple and straightforward, they connect closing prices over a specific period.
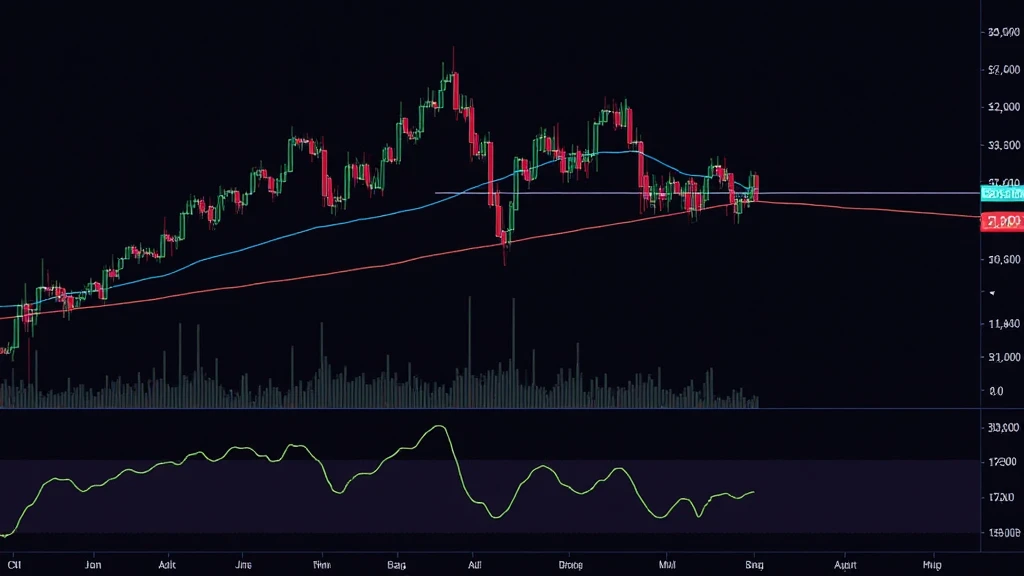
- Candlestick Charts: These provide more information, showcasing opening, closing, high, and low prices, allowing traders to assess market behavior at a glance.
- Bar Charts: Similar to candlestick charts but primarily focusing on highs, lows, and closing prices.
Each chart type offers unique insights. For instance, candlestick charts are particularly useful in identifying market trends due to their visual representation of price action.
Key Technical Indicators
Several technical indicators assist in making sense of Bitcoin’s price movements. Here are some of the most widely used:
- Moving Averages (MA): This indicator smooths out price data to create a trend-following indicator. The Simple Moving Average (SMA) and Exponential Moving Average (EMA) are popular among traders. For instance, the 50-day and 200-day MAs are often used to identify bullish or bearish signals.
- Relative Strength Index (RSI): The RSI measures the speed and change of price movements, helping traders identify potential overbought or oversold conditions. An RSI above 70 typically indicates overbought conditions, while below 30 suggests oversold territory.
- Bollinger Bands: This indicator consists of a middle band (SMA) and two outer bands that depict market volatility. When the price touches the upper band, it can indicate overbought conditions, while touching the lower band might suggest oversold conditions.
Utilizing a combination of these indicators can offer a more comprehensive picture for trading decisions. For instance, observing that the RSI indicates overbought conditions, while prices break above the upper Bollinger Band might warrant caution.
Market Psychology and Trends
Understanding market psychology is critical for successful technical analysis. Investors’ emotions often drive price volatility. Here are some psychological trends to consider:
- Fear of Missing Out (FOMO): This common phenomenon can lead to price surges as traders rush to buy based on hype and speculation.
- Fear, Uncertainty, and Doubt (FUD): Conversely, negative news can trigger panic selling, driving prices down rapidly.
- Support and Resistance Levels: Traders often look at historical price levels where the price has previously struggled to break through (resistance) or where it has had difficulty dropping below (support).
Recognizing these psychological factors can empower traders to make more informed decisions, mirroring market sentiment accurately to forecast potential price movements.
Local Market Considerations: Vietnam’s Growing Interest in Bitcoin
In recent years, Vietnam has witnessed a significant surge in the crypto market. According to a report from hibt.com, the number of cryptocurrency users in Vietnam has increased by over 300% since 2021. This rapid growth illustrates the rising interest in Bitcoin and other cryptocurrencies among Vietnamese traders.
Moreover, the Vietnamese government is considering regulations for cryptocurrencies, indicating a potential shift towards a more stable trading environment. This regulatory framework will likely provide clarity for investors, further encouraging participation in the Bitcoin market.
Conclusion: Navigating the Bitcoin Market with Technical Analysis
Technical analysis plays a vital role in successfully navigating Bitcoin’s volatile market. By comprehending price charts, utilizing technical indicators, and understanding market psychology, traders and investors can enhance their strategies, making informed decisions to optimize their investments.
Bitcoin remains an essential part of the broader cryptocurrency landscape, and as it continues to evolve, staying updated with technical analysis techniques will be crucial for market participants.
As a closing note, remember that while technical analysis can inform your decisions, it does not guarantee results. Always conduct thorough research and consider consulting financial experts.
For more insights on cryptocurrency trends and practices, visit cryptocoinnewstoday.
Author: Dr. Nguyen Hoang Minh, a blockchain technology expert and finance specialist, has published over 15 papers in the field and spearheaded audits for several well-known cryptocurrency projects.


