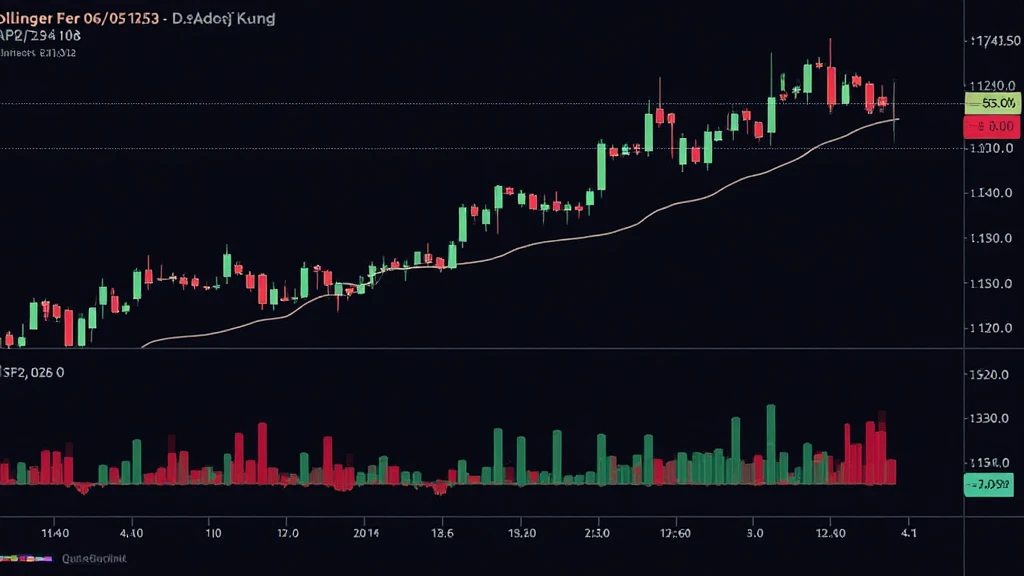
Bitcoin Price Analysis Using Bollinger Bands: A Deep Dive into Market Trends
With Bitcoin currently valued at over $25,000, understanding the dynamics of its price movements is crucial for investors. One of the popular tools that traders utilize is the Bollinger Bands. In this article, we will analyze Bitcoin prices using Bollinger Bands, aiming to equip you with insights for your trading strategies.
Understanding Bollinger Bands
Bollinger Bands consist of three lines: the middle band (a simple moving average), the upper band (the moving average plus two standard deviations), and the lower band (the moving average minus two standard deviations). This setup creates a dynamic price channel around the asset. Let’s break this down further:
- Middle Band: Represents the average price over a specified time frame.
- Upper Band: Acts as a resistance level; prices may be considered overbought when touching this band.
- Lower Band: Indicates a support level; touching this band may suggest that prices are oversold.
Analyzing Bitcoin Trends with Bollinger Bands
Many traders use Bollinger Bands to identify market trends and potential reversal points. By observing the bands, one can infer price movements effectively. Here’s how:

Identifying Market Conditions
Bollinger Bands can signal various market conditions:
- Trend Continuation: When prices consistently touch the upper band, it indicates a strong uptrend.
- Trend Reversal: If prices tap the lower band and show signs of recovery, a reversal might be imminent.
Using Bollinger Bands for Entry and Exit Points
Many traders use the bands to determine ideal entry and exit points for trades. For instance:
- Consider entering a trade when Bitcoin price touches the lower band and starts to rise.
- Consider exiting or shorting when prices reach the upper band.
Factors Influencing Bitcoin Price
Beyond technical analysis, several external factors influence Bitcoin’s price. Understanding these can significantly enhance your predictions based on Bollinger Bands:
Market Sentiment
Market emotions often drive prices. For instance:
- Positive news can spike interest, driving prices up to hit the upper Bollinger Band.
- Negative news may suddenly push prices down, creating a potential buying opportunity at the lower band.
Regulatory Changes
Changes in legislation concerning cryptocurrencies can significantly impact the market:
- New taxation policies in key markets like Vietnam (where cryptocurrency adoption is growing at a rate of 40% annually) can sway investor confidence.
- Understanding these mechanisms can help traders position themselves effectively when analyzing Bitcoin’s price through Bollinger Bands.
Combining Bollinger Bands with Other Indicators
Only using Bollinger Bands for analysis may not provide a complete picture. Combining them with other indicators can improve forecasting accuracy:
The Relative Strength Index (RSI)
The RSI is a momentum oscillator that can give additional insight:
- When prices touch the upper band and RSI is above 70, it might signal an overbought condition.
- If prices hit the lower band and RSI is below 30, this suggests oversold conditions.
Moving Averages
In conjunction with Bollinger Bands, simple moving averages can further affirm trades:
- If price crosses above a moving average while touching the lower Bollinger Band, it can indicate a buy signal.
- Conversely, if the price drops below the moving average near the upper band, it might suggest a sell signal.
Common Pitfalls When Using Bollinger Bands
While Bollinger Bands are valuable, traders must exercise caution:
- Ignoring Broader Market Trends: Relying solely on Bollinger Bands without considering the larger market context can lead to misjudgments.
- Overtrading: Many might be tempted to trade frequently due to the bands’ movements, risking capital unnecessarily.
Conclusion: Mastering Bitcoin Price Analysis
In conclusion, understanding Bitcoin price analysis using Bollinger Bands can be a game-changer for traders when paired with broader market insights and additional indicators. With the cryptocurrency landscape evolving rapidly, those keen on navigating this space must remain alert, knowledgeable, and prepared to adapt strategies to maximize their investment potential.
As the cryptocurrency market continues to fluctuate, remember that the insights shared in this article are for educational purposes only. Not financial advice—always consult with your financial advisor or local regulators before making investment decisions.
For further insights into cryptocurrency trends, don’t forget to visit hibt.com. Explore the potential of Bitcoin and other cryptocurrencies today!


